Logging#
Logging Dashboard#
See Getting Around page for information about how to access the logging dashboard.
All users with an account to access the amazee.io Lagoon dashboard, will be able to access the logging dashboard. Which logs a user can see and which tenants you have access to will depend on which groups a user account is associated to in Lagoon.
A Lagoon group will have an associated tenant in the logging dashboard which can be used to view logs for projects associated to that group. Only users of that group will have access to the tenant, so this is a convenient place to store your custom visualisations, saved searches and dashboards.
Log retention#
amazee.io will by default store logs for:
- The current calendar month (open 🟢)
- The last calendar month for
routerlogs (open 🟢 until roughly the 10th of the month, then they will be closed 🟡) - The last calendar month for
application,lagoonandcontainerlogs (closed 🟡)
Closed 🟡 indices can be re-opened with a support ticket. Only open 🟢 indices can be searched.
Logs older than 2 months are deleted 🔴 to ensure the cluster stays healthy.
Dedicated Cloud customers are able to have their logs shipped to other locations of their choosing. Please reach out to support if you want to know more.
Select a Tenant#
Tenants are used to group log indexes and restrict access. Before searching for logs, make sure to select the appropriate tenant. You may need to do this every time you log in.
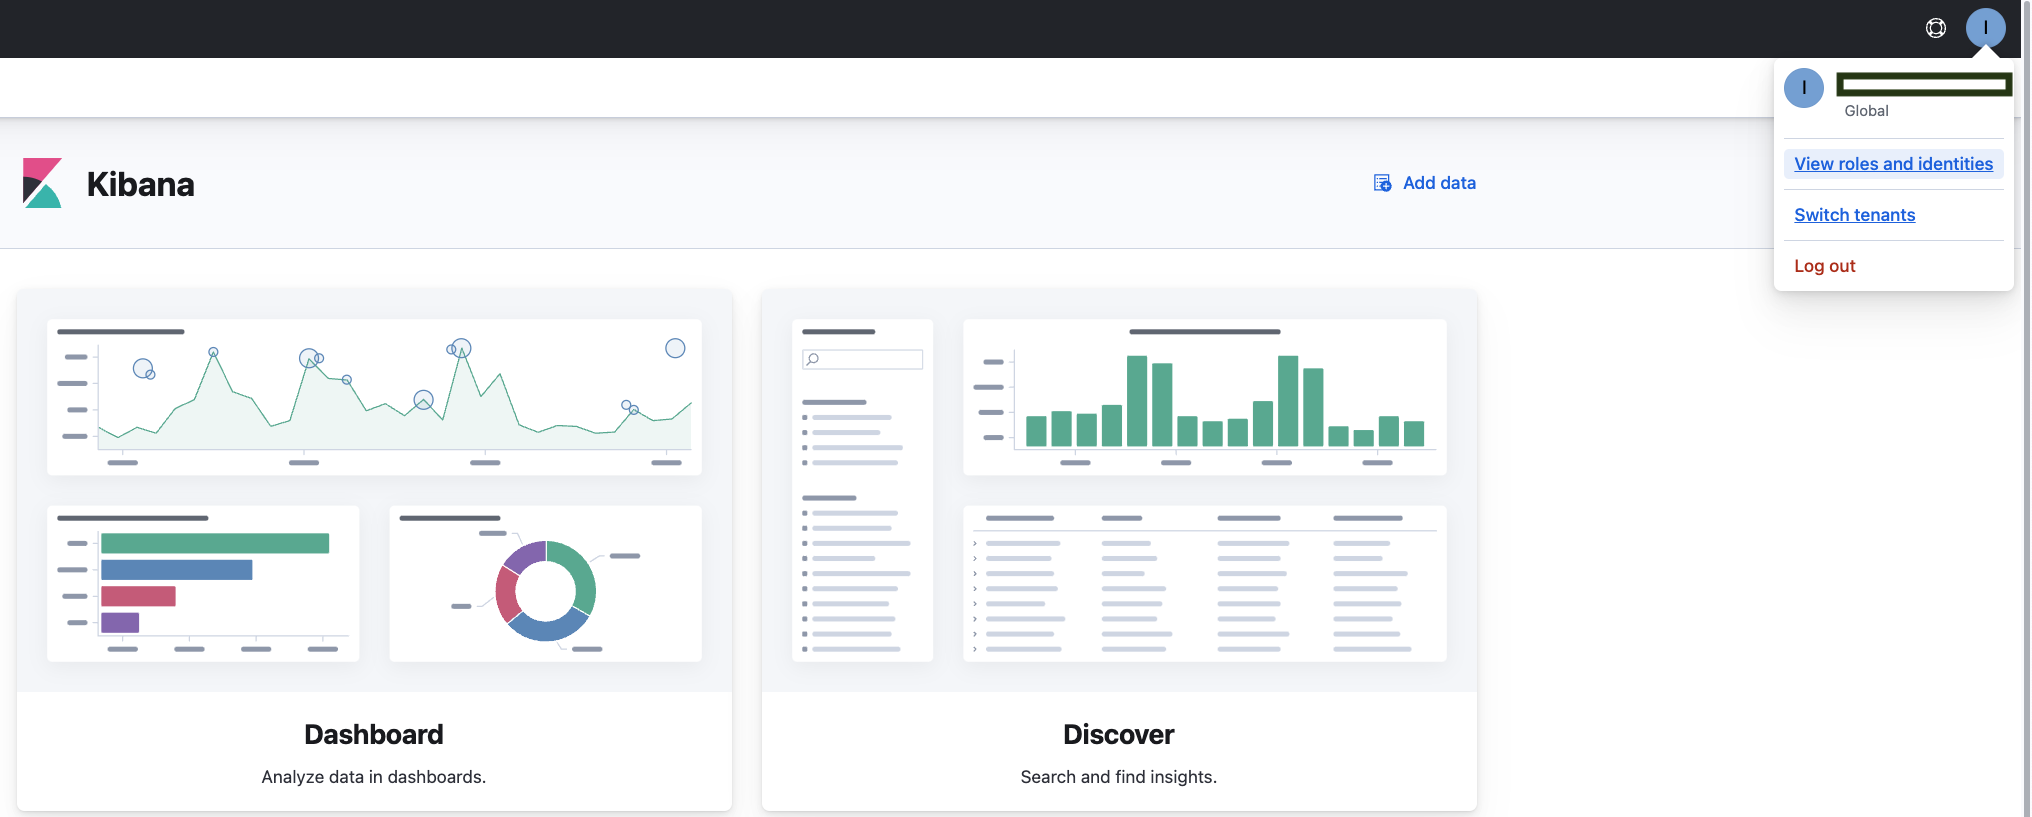
-
Open your user profile menu and select "Switch tenants."
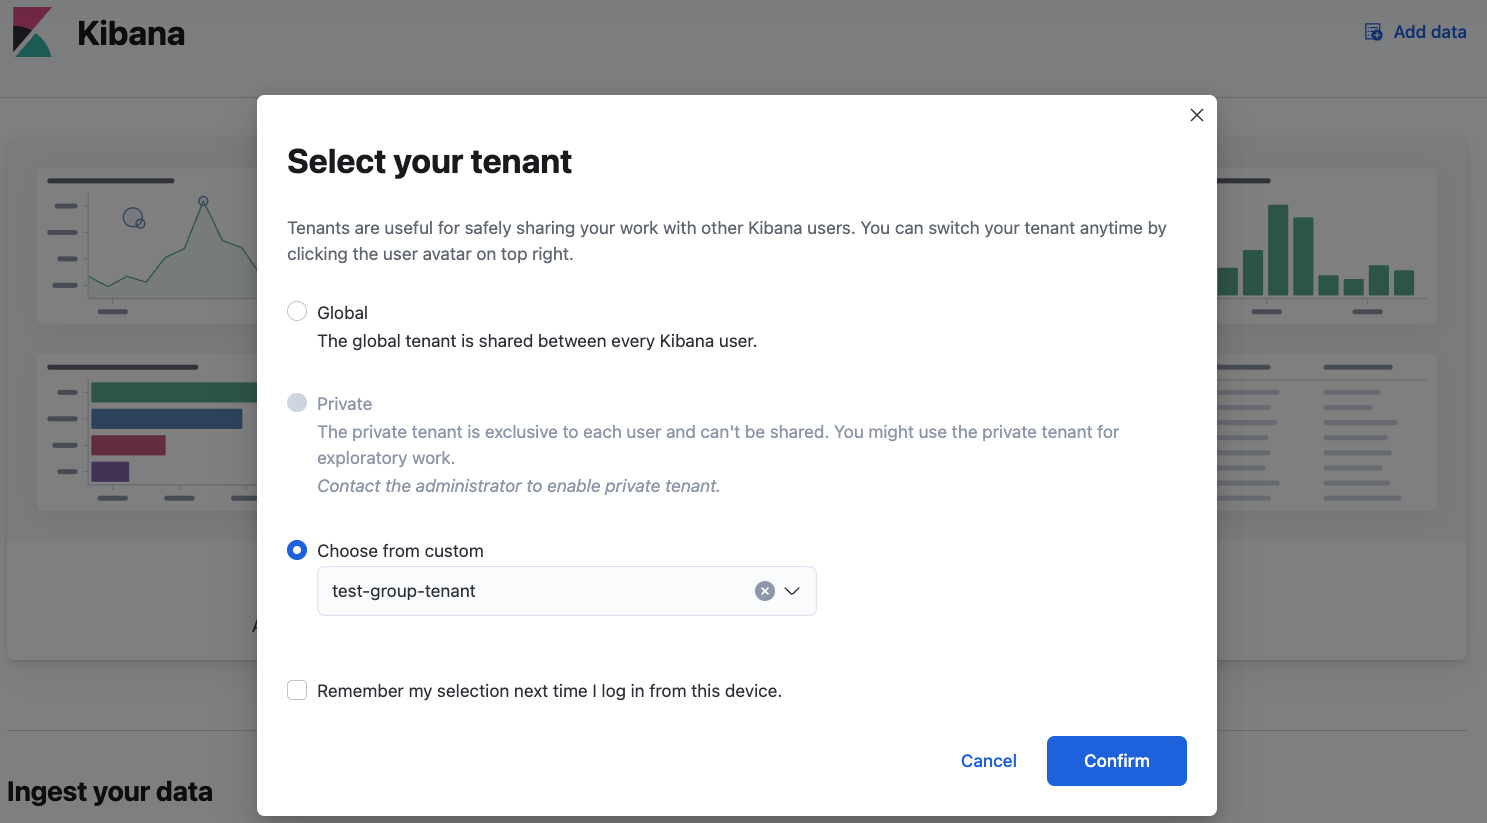
-
You'll see a pop-up window that says "Select your tenant." Select "choose from custom," select your tenant, and click "confirm."
Real time container logs via Lagoon CLI#
It is possible to view a live stream of container logs for a Lagoon service using the Lagoon CLI logs command.
Check the linked command documentation for additional flags that it may support.
This command will show you container logs for the specified service from the currently running pods in the cluster, and the --follow flag will stream logs in real time.
This feature is useful for diagnosing an issue without having to access the logging dashboard.
Note
There are limitations on how long you can follow logs for, and how much log history is accessible with this feature.
Logging examples#
Once you have selected your tenant and clicked on the Discover icon, you will find a menu on the left-hand side that lets you interract with the logs.
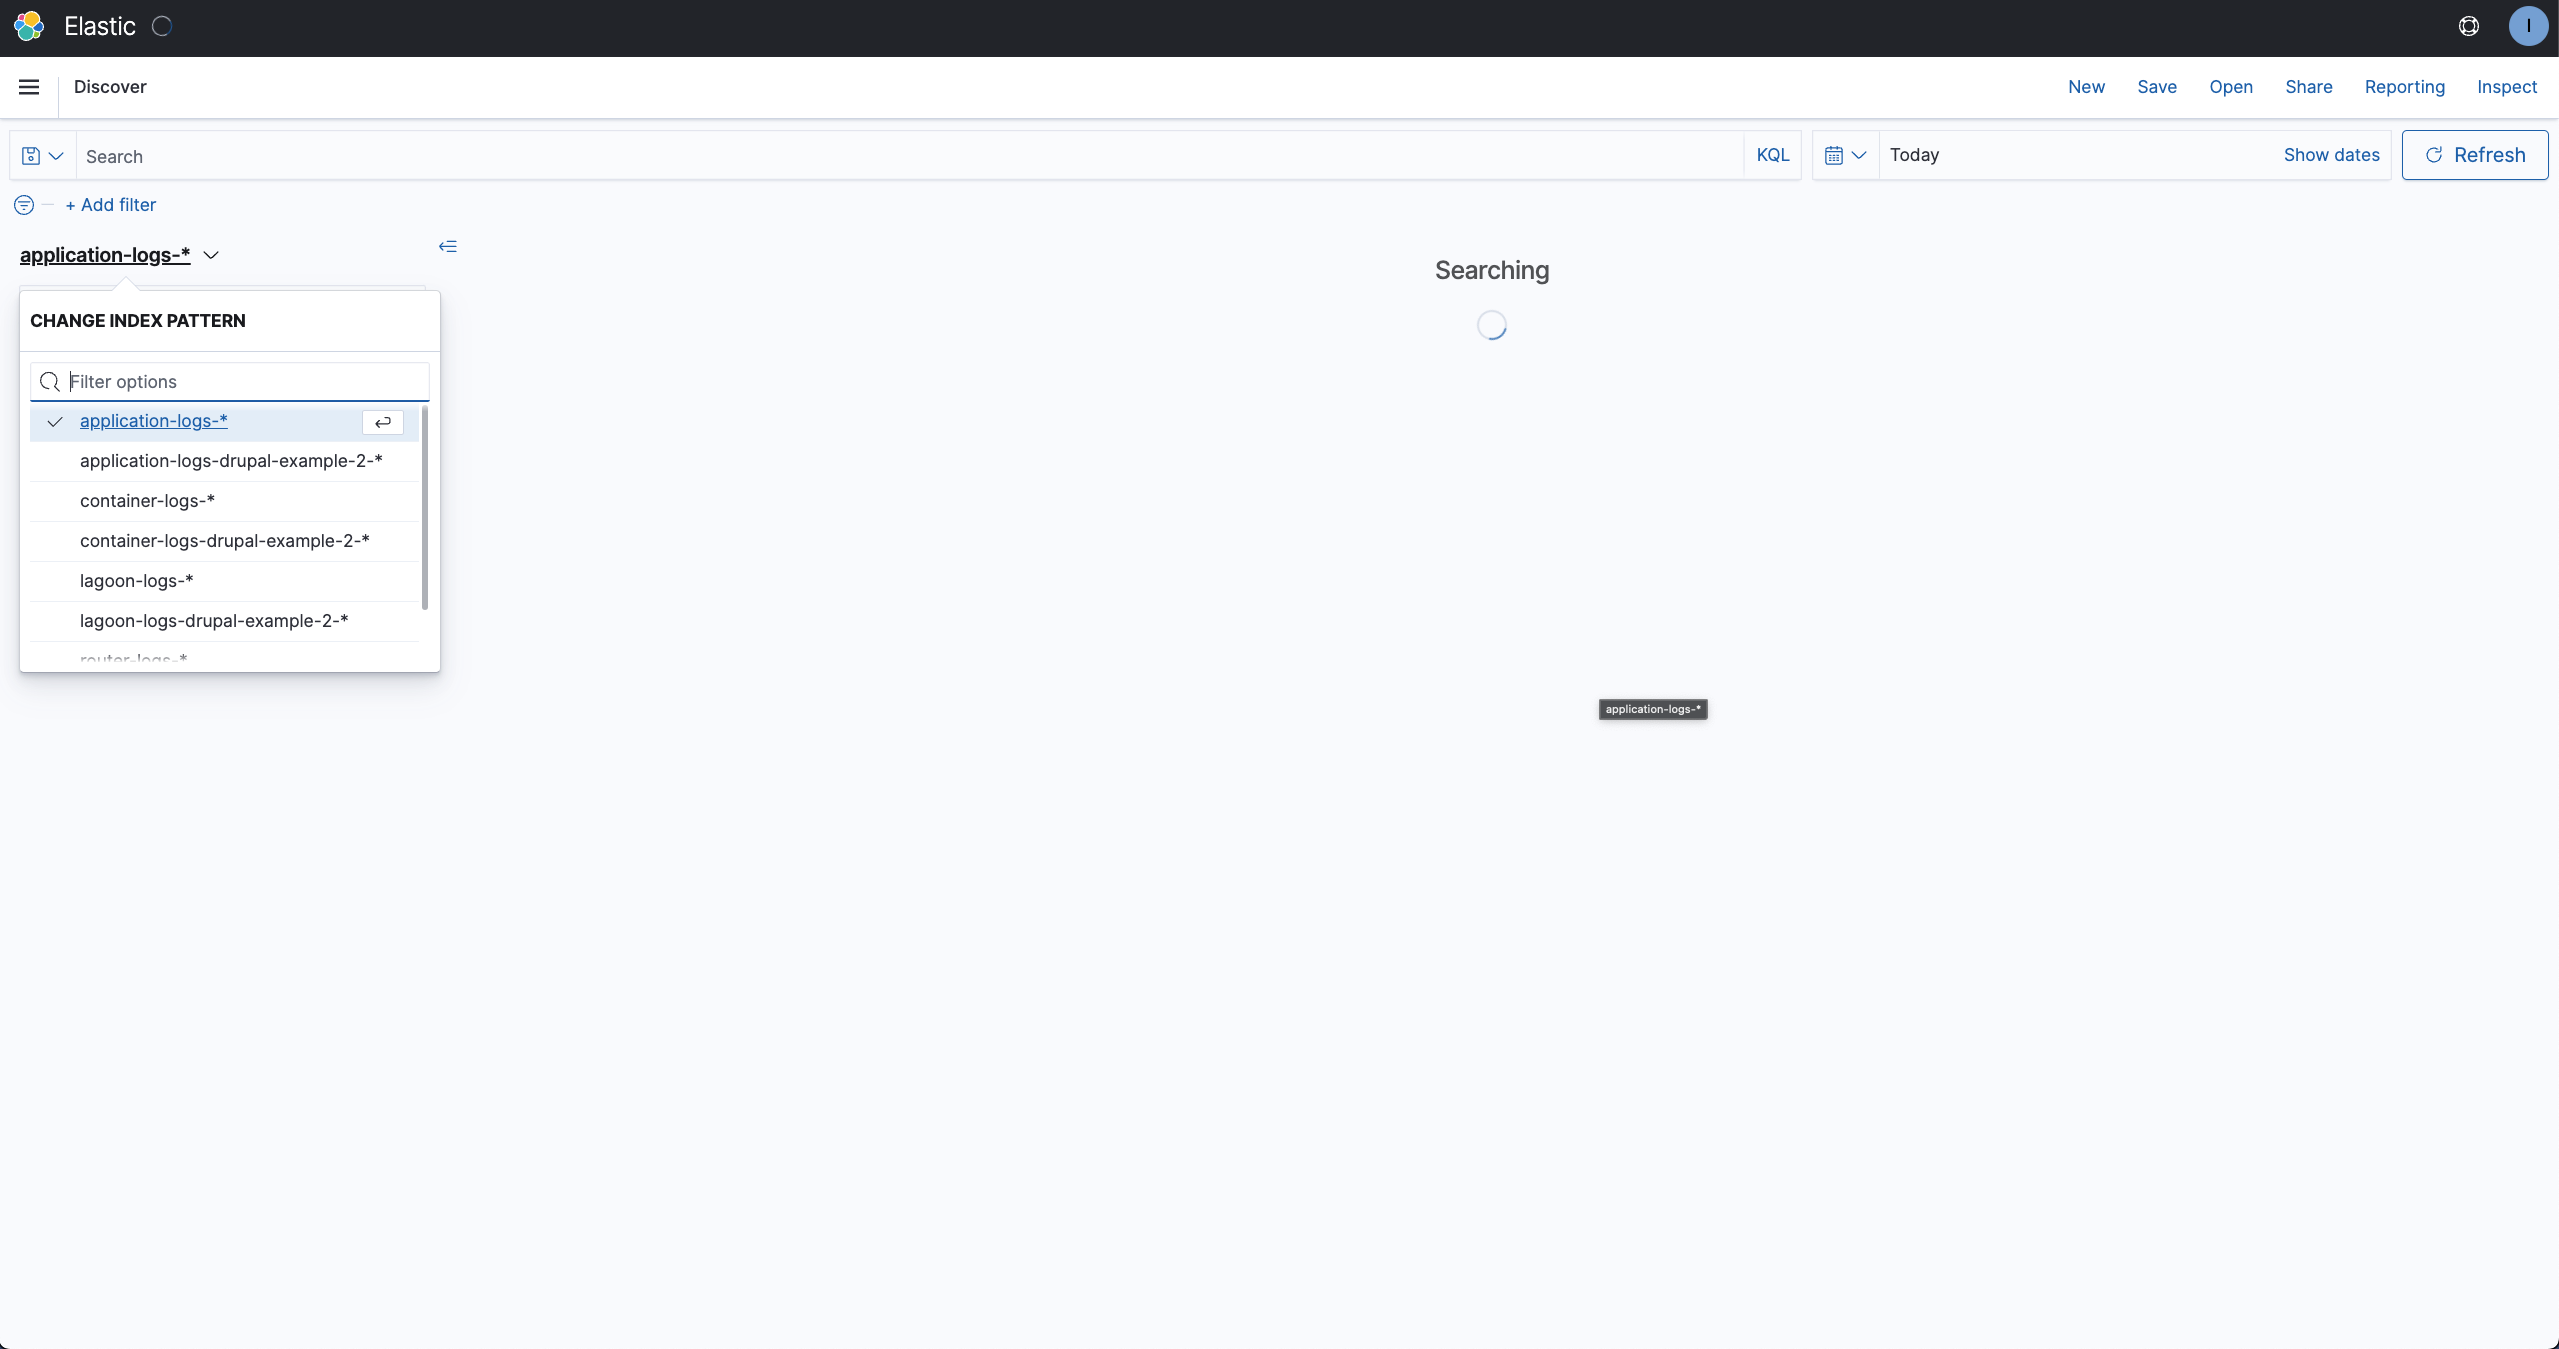
Choose the index pattern corresponding to the logs you want to browse for your specific project.
You can use the available fields to filter or the search bar by using the corresponding fields.
Please see bellow a list of available logs and some examples.
Router Logs#
Router logs will show you external HTTP requests toward your application.
Below you'll find examples for two common log requests:
- Viewing the total number of http requests to your site.
- Viewing the number of http requests from a specific IP address.
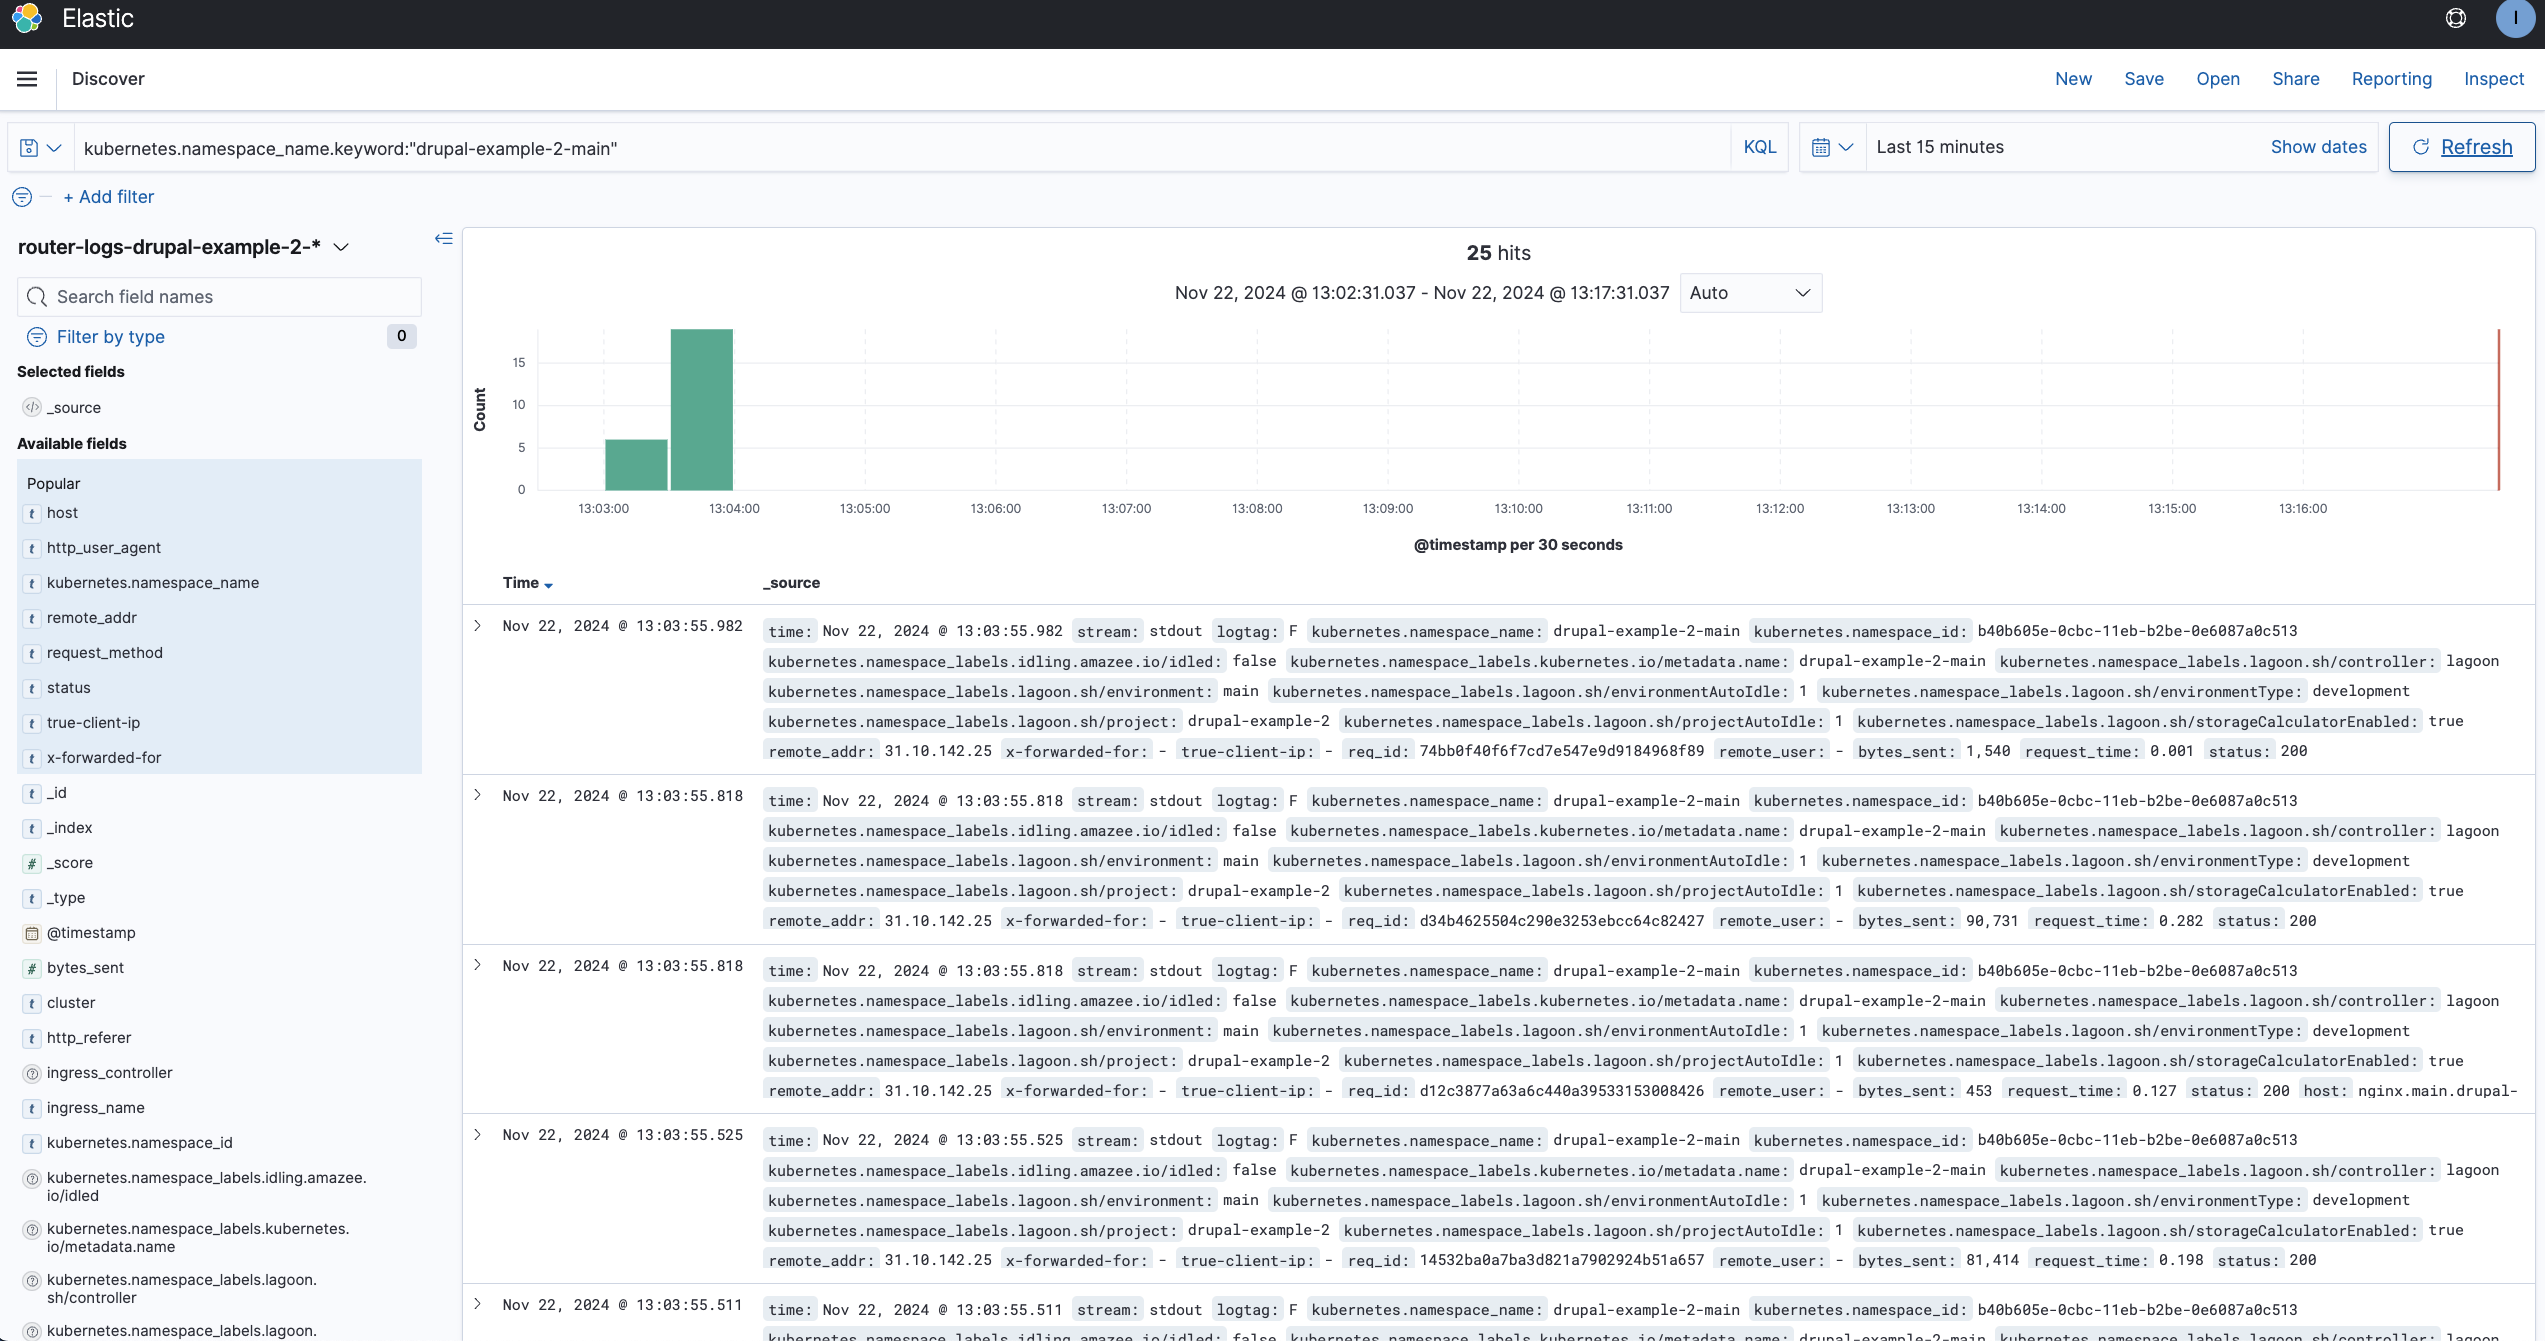
Total Number of http requests to your site:#
Info
for filtering the namespace use the following query in the search bar : kubernetes.namespace_name.keyword:"example-project-main"
OR
use the kubernetes.namespace_name field from the available fields on the left hand side
- This will show you all the http requests to your selected environments in the given time frame.
- You can change the time frame in the field next to the Search Bar.
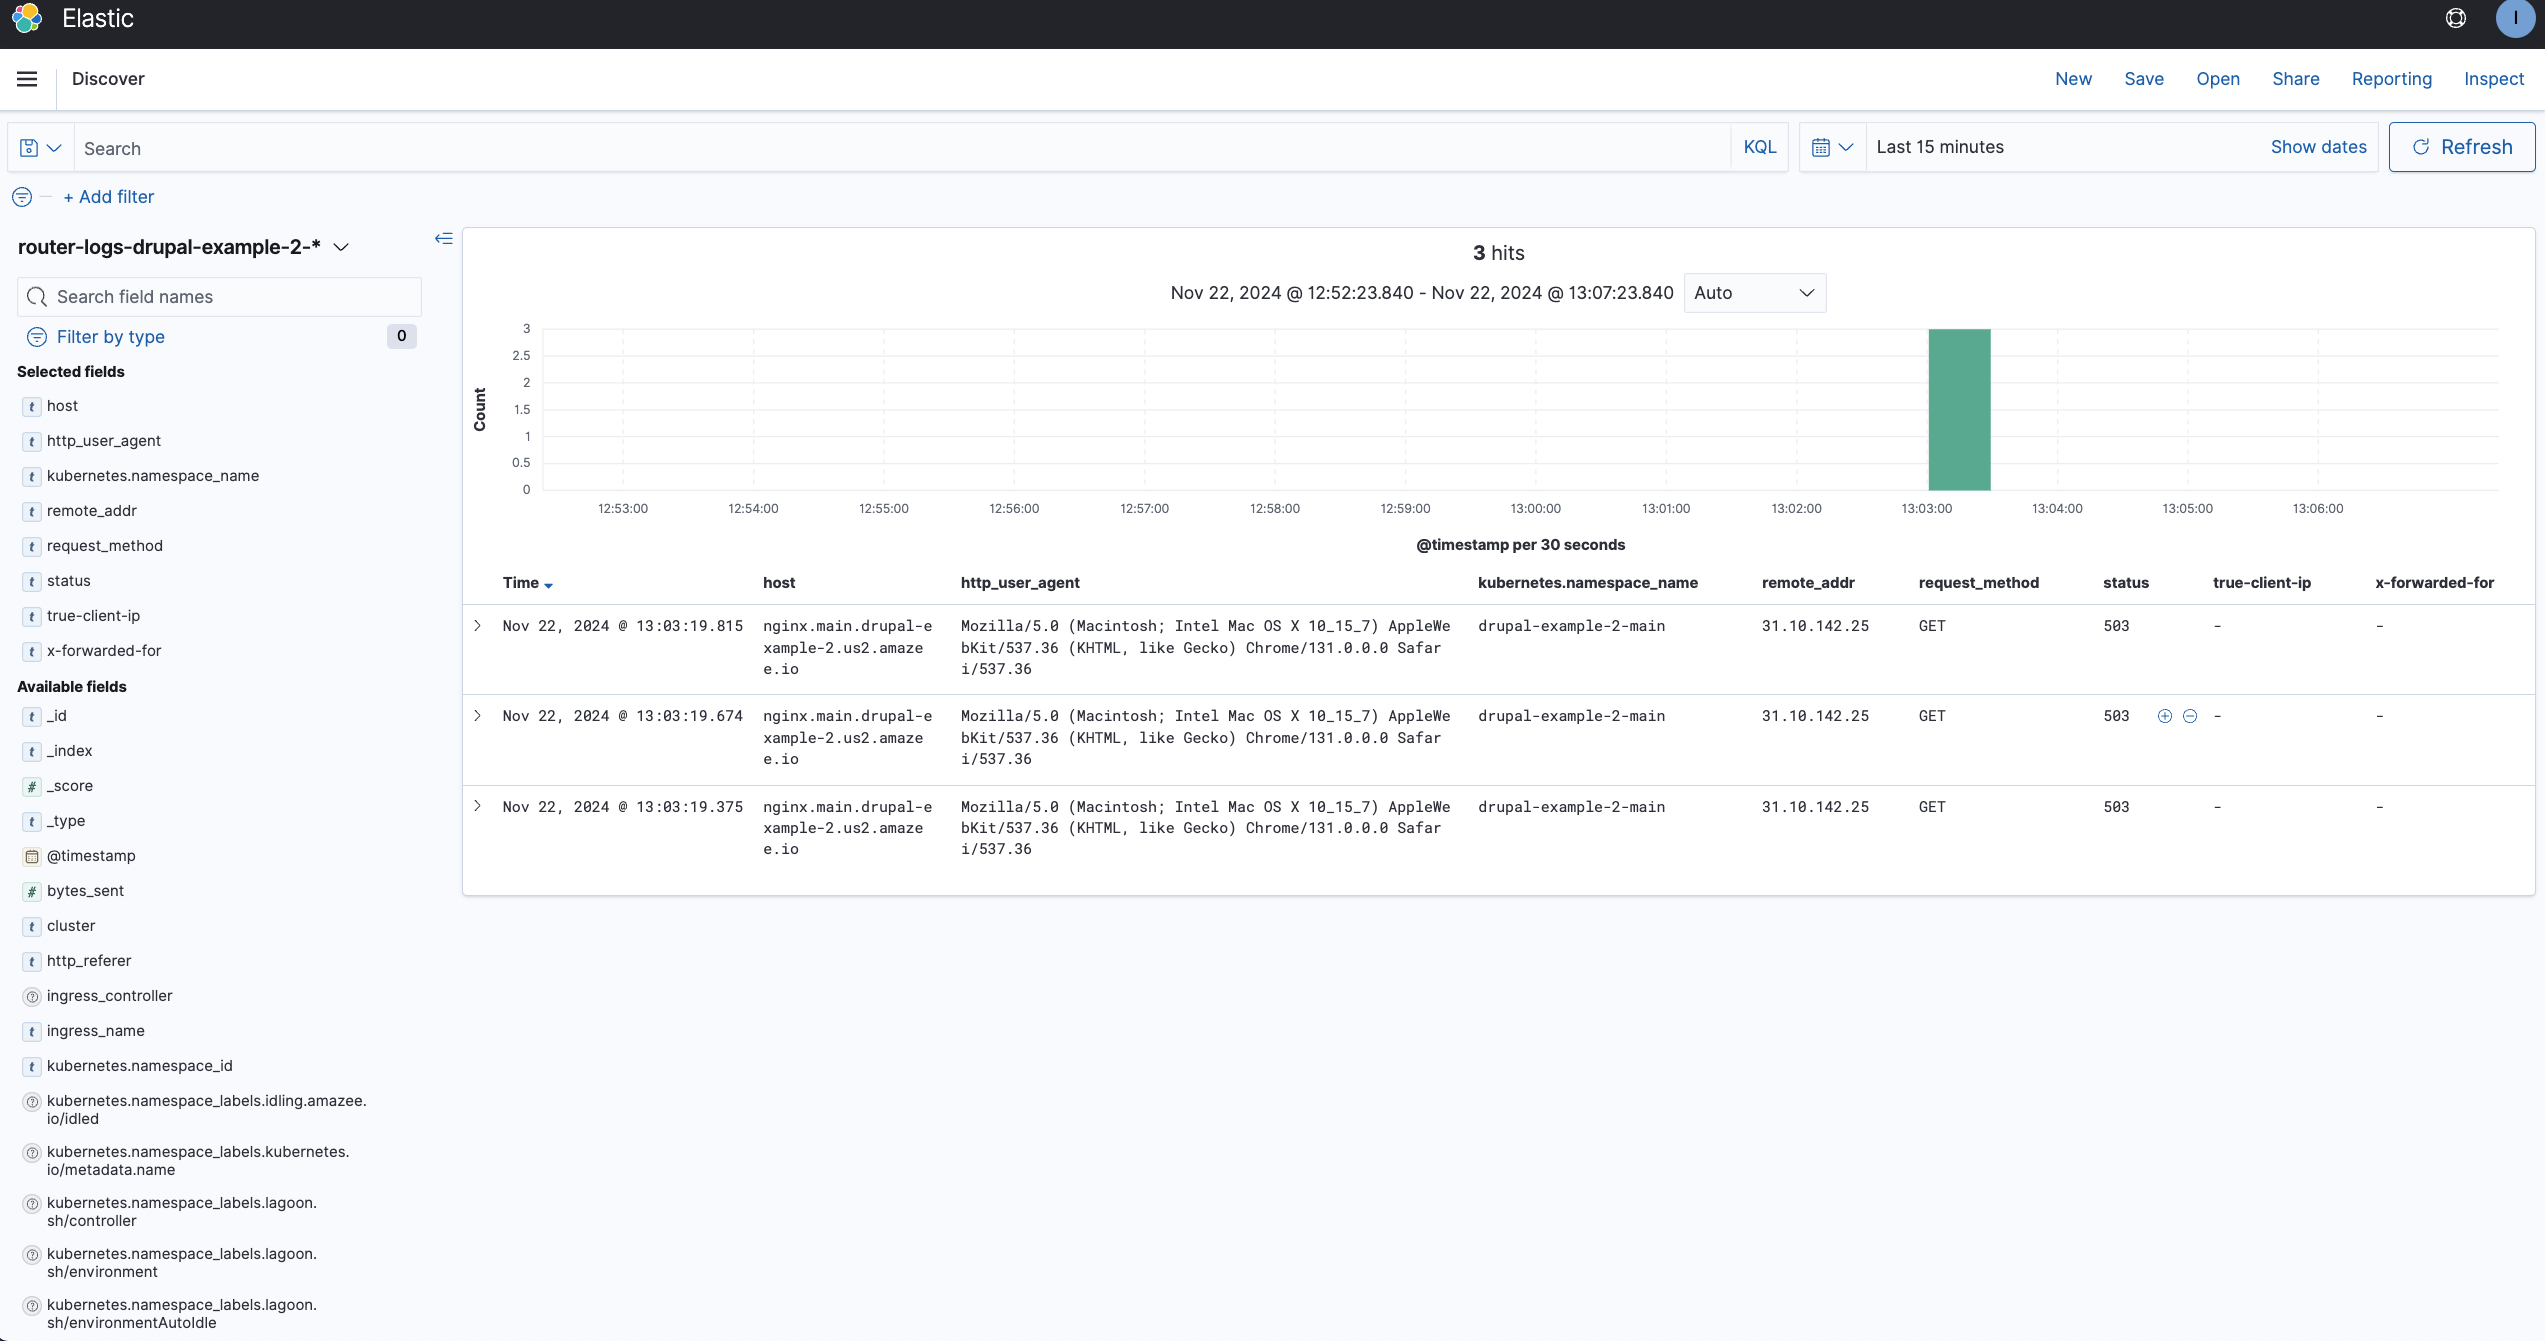
Number of http requests from a specific IP address#
You can use the available fields on the left hand side to analyze the router logs in order to understand the request volume to your site and where it's originating.
There are plenty of available fields but in this case the most useful fields are:
- host - this represents the host that receives the request.
- http_user_agent - this represents the agent that performed the request (e.g. a browser OR bot OR crawler, etc).
- kubernetes.namespace_name - this represents the kubernetes namespace where the host lives.
- remote_addr - this represents the IP address that made the connection to the
ingress-nginx
Note
This is only relevant if the traffic doesn't come through a CDN.
- request_method - this represents the request method that was used to make the request.
- request_uri : this represents the URI that was requested.
- status - this represents the status code provided to the client's request (e.g. 200, 404, 503).
- True-client-IP - this represents the actual IP of the client issuing the request to the CDN.
- X-forwarded-For - the X-forwarded-For request header is a de-facto standard header for identifying the originating IP address of a client connecting to a web server through a proxy server.
Info
In our case this header (X-forwarded-For) is good to debug CDN chaining ((e.g. Cloudfare -> Fastly -> amazee.io). When chaining CDN, True-Client-IP will be the IP of the CDN before Fastly.
There are different request paths where the true-client-ip and x-forwarded-for headers will have different meanings(dirrect cluster hit vs Fastly vs custom CDN).
When traffic goes through our own dedicated Fastly service we explicitly discard whatever was put in the headers by the client, and enforce writting the actual IP address that was connecting to Fastly. So true-client-ip is reliable to understand where the request originated from.
When traffic goes directly to the cluster (no CDN) or through a custom CDN those headers cannot be reliable as they can be tampered with/ not set.
You can check the remote_addr field but if the traffic goes through a custom CDN, the IP shown will be the one of the CDN.
Container Logs#
Container logs will show you every output of every container, you can find nginx access logs, php error logs, cronjob logs, etc.
Bellow you can find examples for some of the most common log requests:
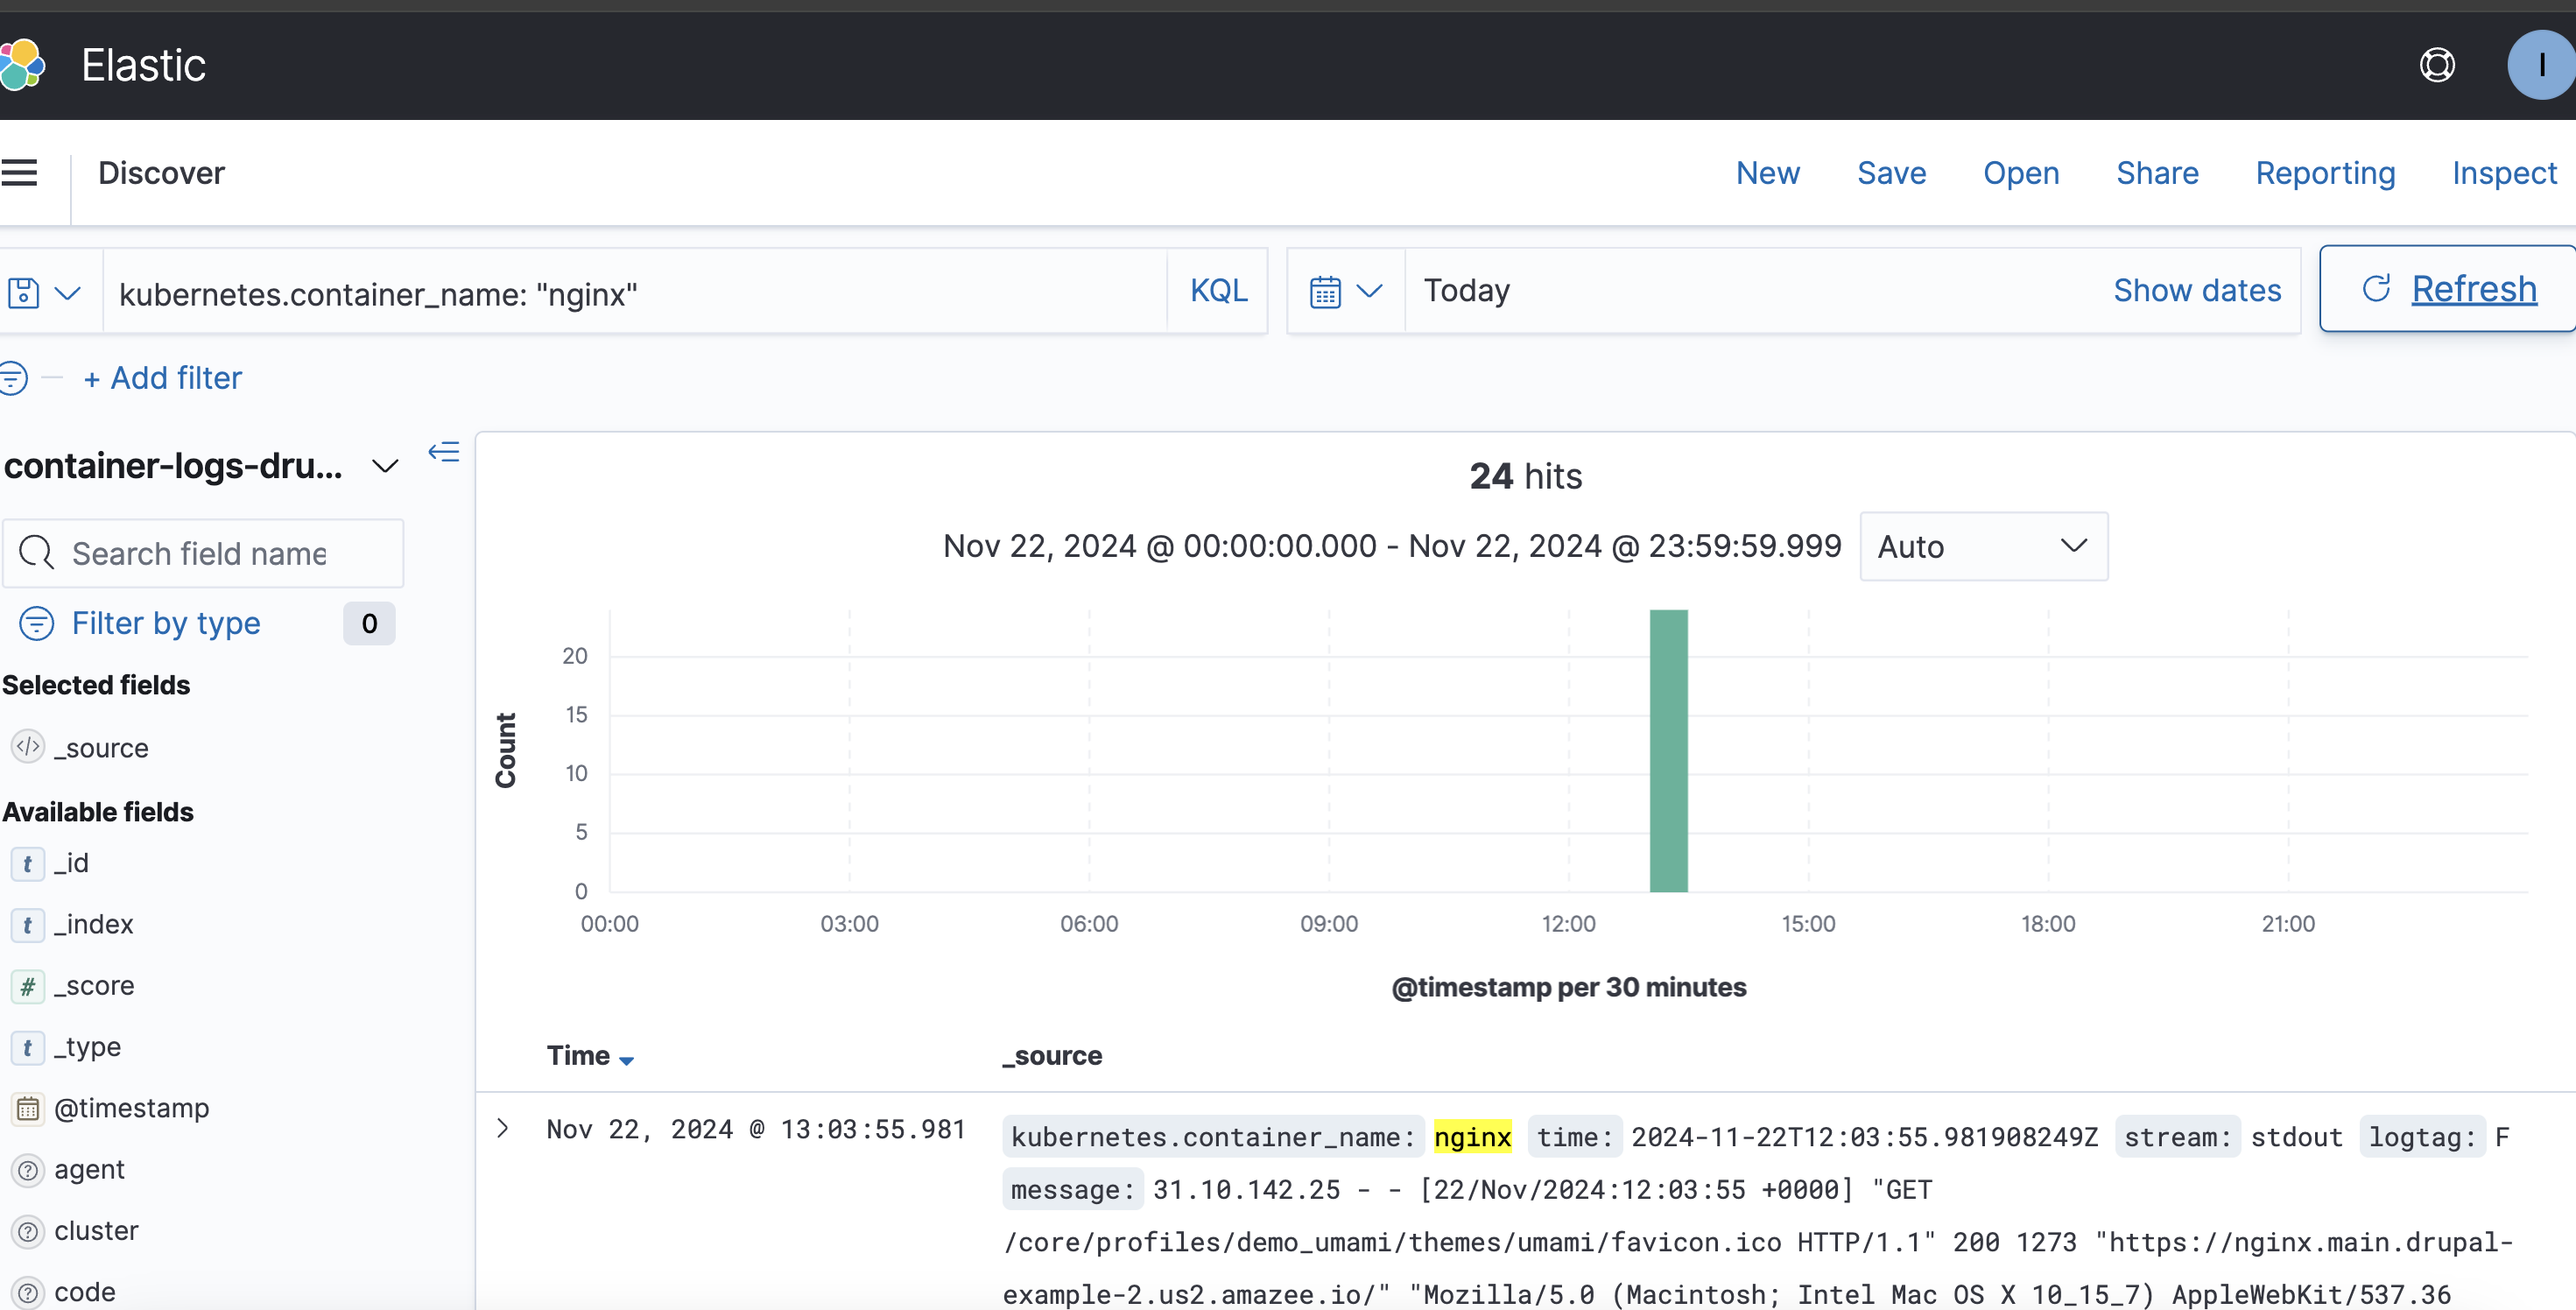
Logs from nginx container#
If you want to see specifically nginx logs, you can go to the search bar and enter kubernetes.container_name: "nginx"
This will display all nginx logs for your project. If you want to filter using the Search bar, you can use specific queries, for example, searching how many 500 Internal Server errors you had in your nginx container: `kubernetes.container_name: "nginx" AND message: "500"
That will display 500 error messsages in the nginx container. You can search for any error message in any container that you would like.
On the left hand side you will find many more available fields but the most relevant are:
- kubernetes.container_name - this represents the logs of the containers deployed in your namespace
- kubernetes.namespace_name - this represents the list of all environments in your project
- kubernetes.pod_name - you can filter for which pod in the container you want to see logs
- message -
stdoutandstderrmessages for your containers - path - the path that was requested
- method - this represents the method that was used to make the request
- agent - this represents the agent that performed the request
- code - the request method that was used to make the request
- stream -
stdout,stderr
Vizualizations#
Note
Visualizations can only be created when a tenant is selected
You can also create visualizations or graphs. For e.g. if you want to see the number of http requests in a month using the same query as above you can follow the example bellow:
- Click on Visualize on the left hand menu.
- Click on the blue plus sign.
- For this example, we are going to select a Vertical Bar chart.
- Select the router logs for your project.
- Click on the X-Axis under Buckets and Select Date Histogram, with the interval set to daily.
Note
Make sure that you select an appropriate time frame for the data.
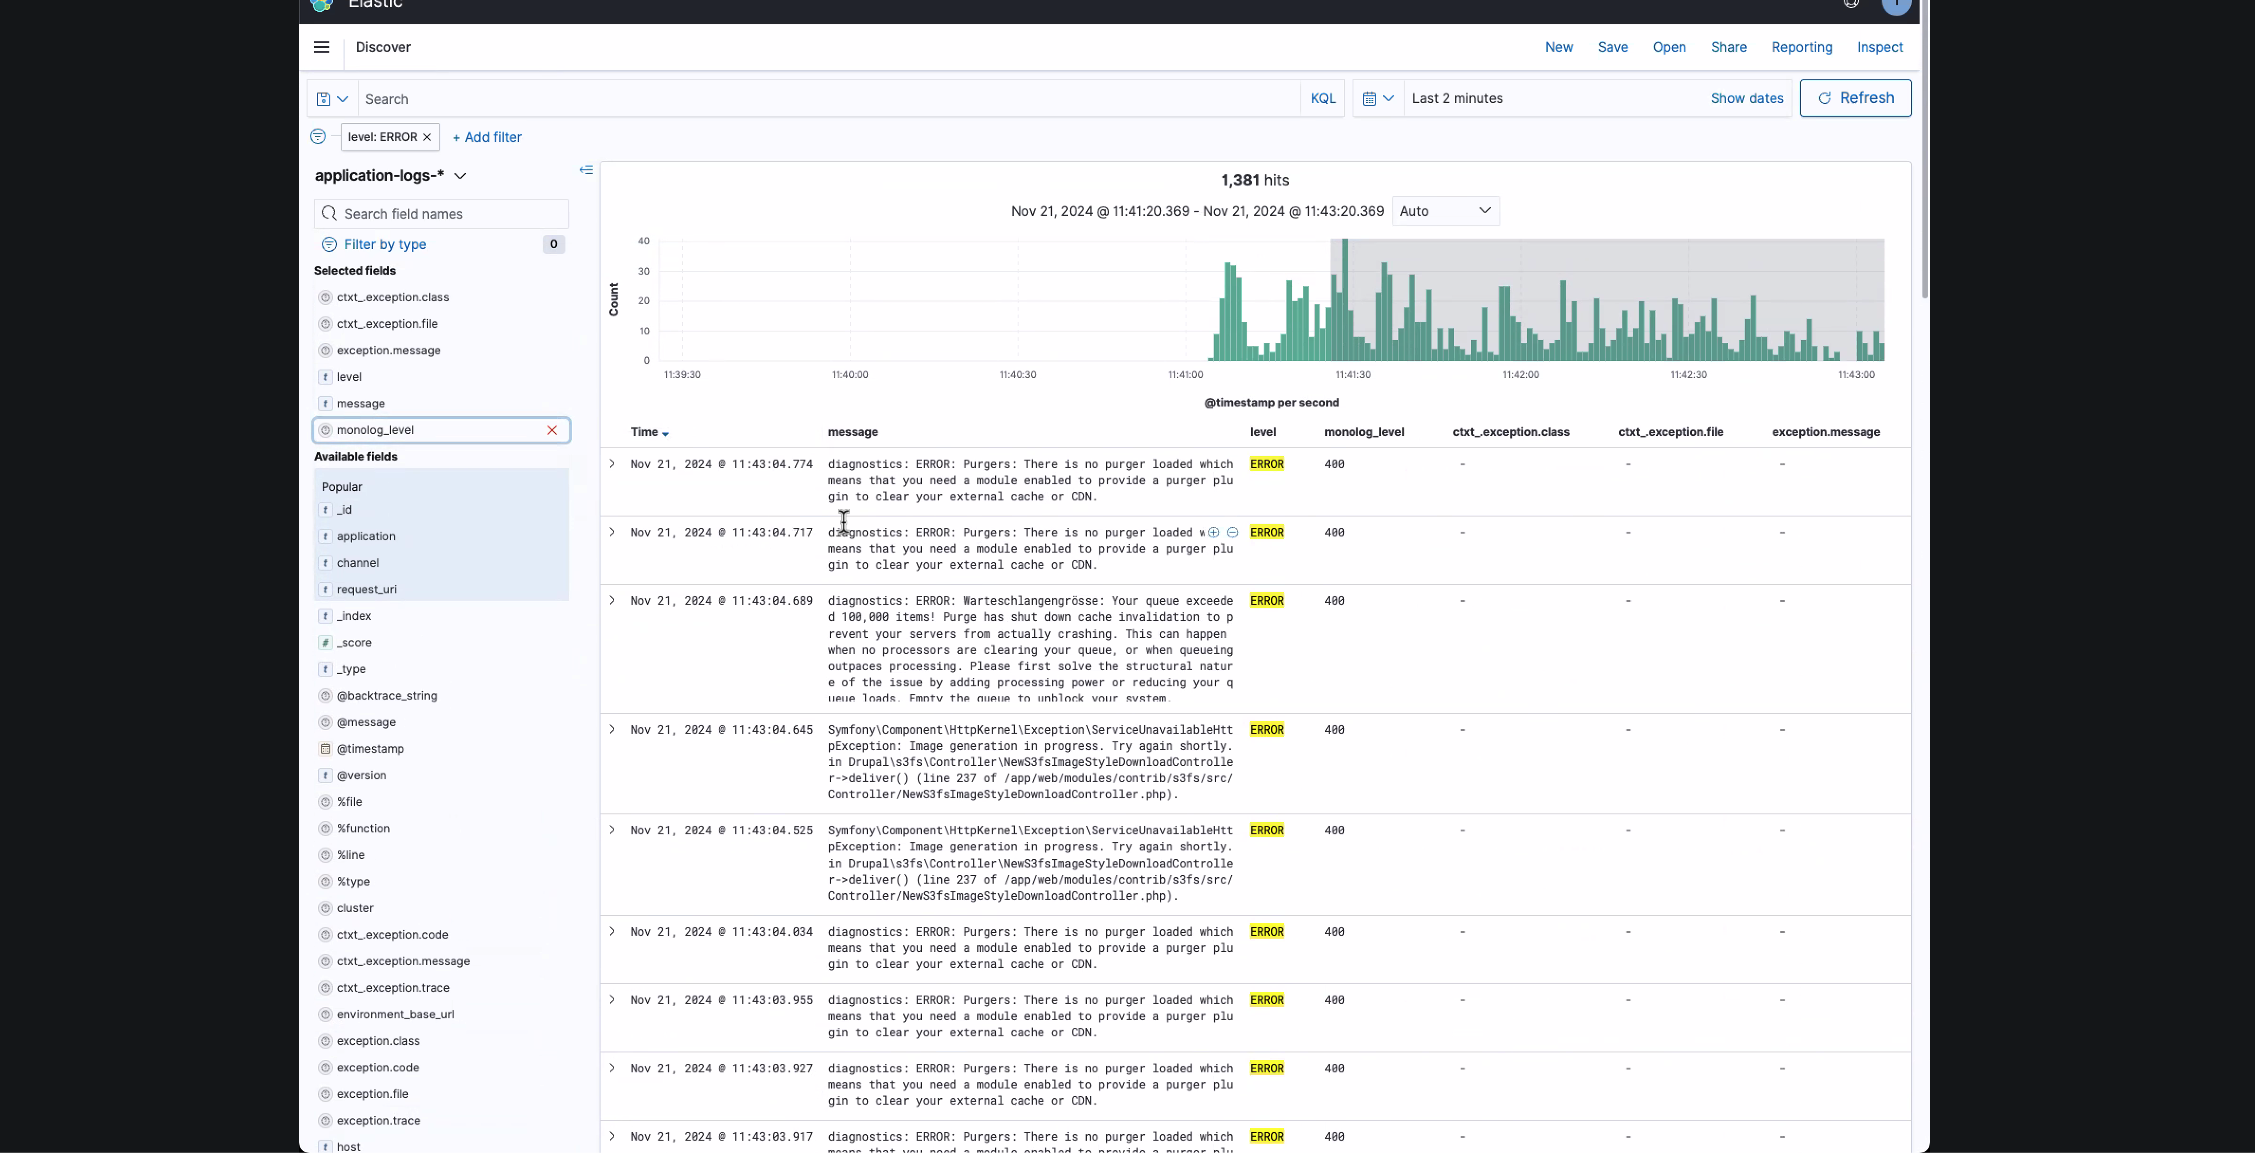
Application logs#
Application logs will show you drupal logs together with the Lagoon logs module.
On the left hand side you will find many available fields that can help you debug your application.
Lagoon logs#
Lagoon logs is another way to view the environments build logs that are available in the Cloud Dashboard.
This is a much slower way to do it though.
Further Reading#
Lagoon Logging documentation.